I kept a diary of all my media consumption throughout the week, by recording each “piece” of media (for example, one article, one book), and coding them along several dimensions in a spreadsheet (such as: device used, primary / secondary source, reason accessed, found via algorithm or not, etc.).
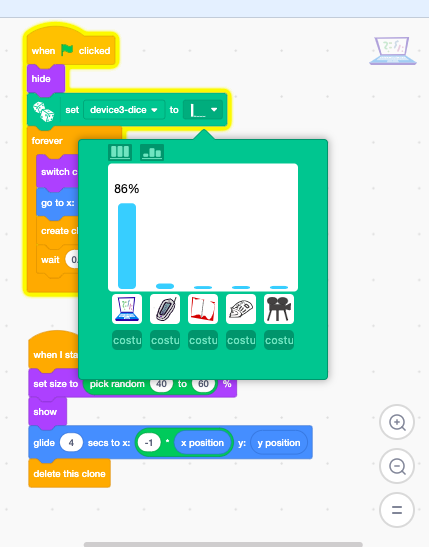
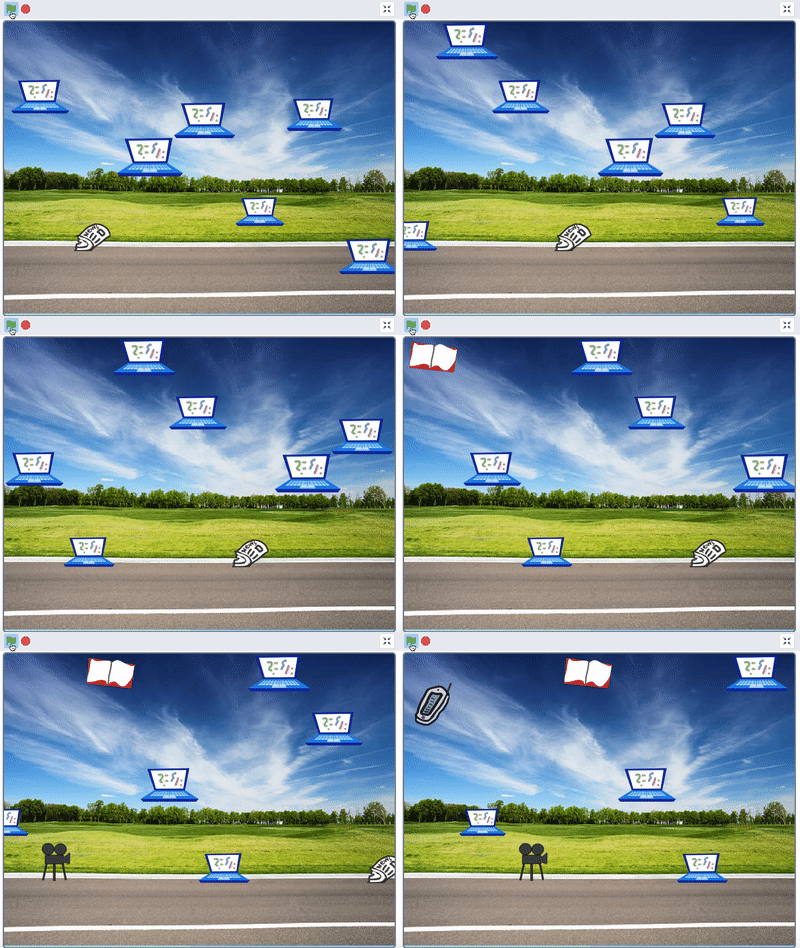
My Lifelong Kindergarten colleagues Shruti Dhariwal and Manuj Dhariwal have been working on an extension to Scratch for exploring probability (called “Let’s Chance”). I remixed one of their example projects (Wish a Fish) to make a highway with devices passing by – each representing an object for accessing media (computer, book, newspaper, phone, movie).
The objects appear in keeping with the frequencies of my use of them in the past week.

Here’s the Scratch project (as a screen recording – the actual project was made in a separate GUI that they are working on).

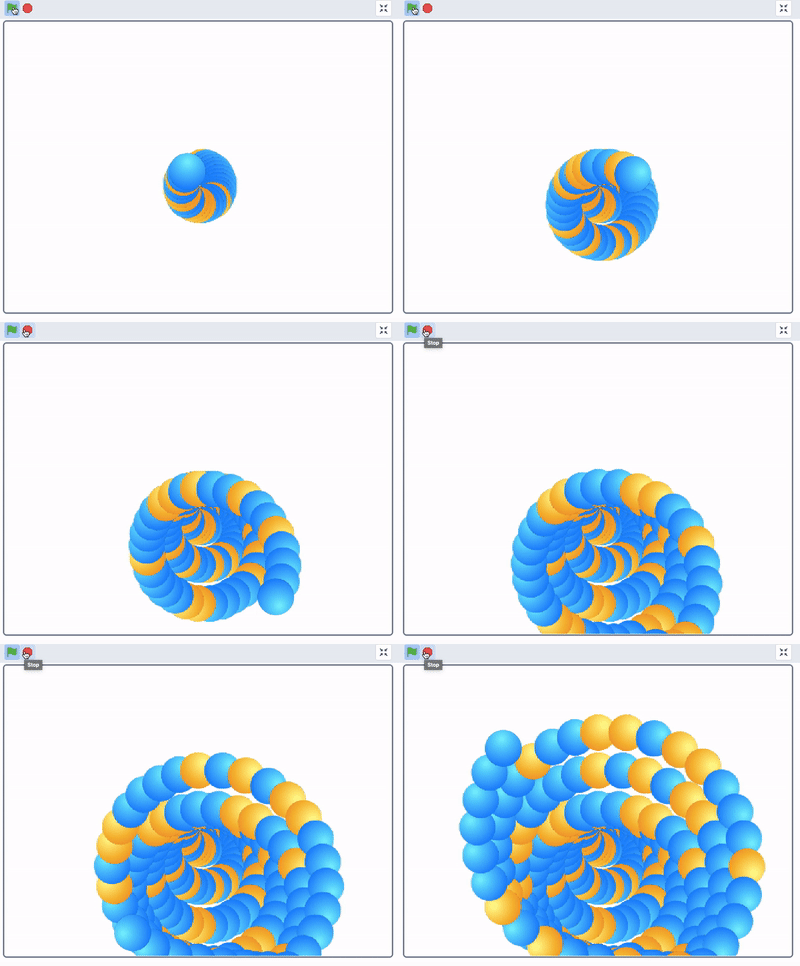
Here’s another one, representing how much of my media consumption was algorithmically generated. Yellow is algorithmic, blue is not.

Other findings:
- 30% of my media diet appears to be algorithmic in nature. But it’s hard to know, in an algorithmic world, how many are “second-hand” algorithmic – if someone recommends that I watch something that Netflix pushed for them, I’m still under some algorithmic influence, arguably. Of the media I encountered, 10.5% was recommended to me by other people.
- My “diet” is fairly balanced between primary and secondary sources.
- 22% of media was required by my courses.