Summary
So much discussion is happening these days that is backed up with data visualization (charts or graphs), but the problem is, misinformation and trust issues could arise due to the fact that these visualizations are not fully understood, or can’t be reproduced to more accurate versions unless the author of the chart decides to do so. In this work, I explored simple and lightweight workflows to democratize the process of discussing data on the web for social and knowledge seeking purposes. I looked into existing tools that empower users to visualize data on the web but they are disconnected from where the discussion is happening (i.e. social media). I have built “vizdat!” a solution that is a layer over online communities that discusses data visualizations (charts) to allow community members to visualize and reproduce charts in-situ to improve the commenting experience and enrich online discussion around charts.
Background and Motivation
Whenever there is data shared on the web as a chart and there is a comments section, the discussion is often only in text [e.g The Upshot, The Economist, Reddit, etc.] Imagine you are on twitter, a blog or reddit. You saw a chart (visualization) but felt something was wrong or wanted to discuss or add something to that chart. The way the web currently works, is that a person shares a chart online and in the comments people are only allowed to reply with text!
I asked one of r/dataisbeautiful moderators about how to share charts in comments, and his answer was the following
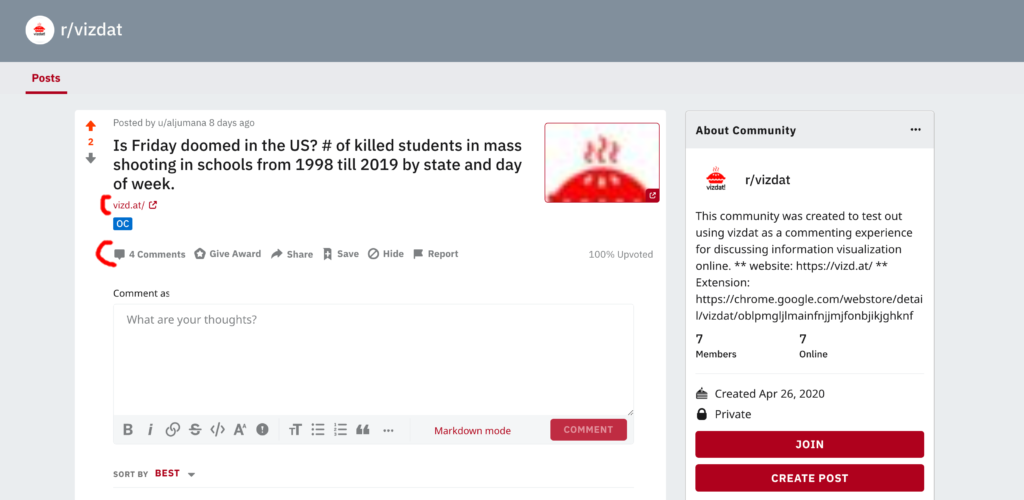
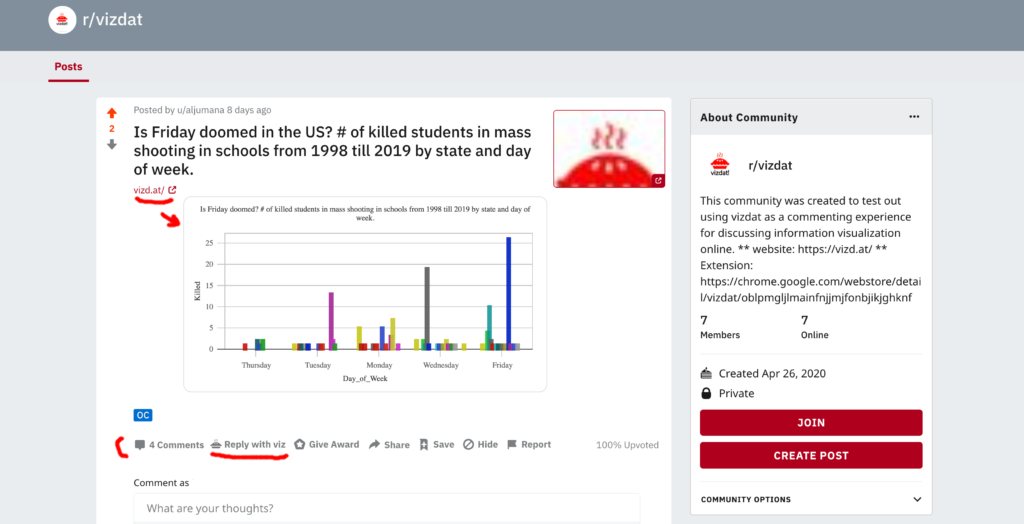
There has to be a better way to discuss charts online! What if we make the comments section more visual and interactive . What if we enable users to comment with charts, not just text, to extend the discussion around the data story even further. That’s where vizdat! comes in. vizdat! is a website + a chrome extension that changes the UX of online communities to enable users to discuss interactive charts with interactive charts, instead of just text.
Design Research
The idea started when I started talking to social media influencers who like to share media in general with their audience. I started exploring the question: How might we enhance the commenting experience online?
This question felt too broad so I narrowed down the commenting experience on media that is in the form of charts and graphs. So I focused instead on: How might we facilitate online discussion around charts? In order to narrow down the design scope even further I looked into quantified self communities, data journalism outlets, twitter, facebook and reddit. Discussion around charts is everywhere yet, text comments are the norm! so: How might we make visual comments anywhere, anytime on the web? That is my main research question.
For this design document, I narrowed the audience down to one interesting and safe community, which is r/dataisbeautiful on reddit. I have improved my prototype around the technical and social constraints in that community. How might we improve discussion around data on r/dataisbeautiful? In order to answer that question for this project I have performed the following:
→ digital ethnography
→ contextual analysis
→ need finding
→ built vizdat based on the identified needs
→ posted on reddit, but not so much traffic to my stories, and some of them got removed. (stricts moderation)
→ reached out to mods, I wasn’t allowed a recruitment message
→ created a subreddit that simulates r/dataisbeautiful with all it’s restrictions and rules (e.g. no posts with text only links and images, original post must be marked with OC and so on).
→ usability tested and observed how users react on that simulated community
Interview
I interviewed a Quantified Self speaker who is also a social media influencer. I was curious about how he shares his data with his huge audience. For example, he is a runner and he uses Strava to share his runs as shown in the image below. He does have a huge following on the app but he only gets likes as opposed to comments.
Strava: through this app the runner shares his stats and runs.Although the app allows for commenting, he gets likes only, no comments.
He tried sharing the same charts on facebook and reddit and he rarely got any meta comments or any useful comments. When he spoke at QS he shared his data with like minded people and according to his words he loved the comments and insights he got from people who were interested in his data. In my interview with him he made the following comment:
I would love it if I could have people like me look at my data and I look at their data whether it’s a log data from running experience or so and then comment on them a meaningful comment that would be nice but the current apps don’t allow this the only thing that I get from sharing my log is people asking me about the best running shoes or how do you get yourself to run and stuff like that which is not relevant to the data I’m sharing and that’s two to the app limits in my opinion
I followed up with him by asking him what he meant by a meaningful comment and his reply was:
Meaningful comments to me would be something that is:
- investigating the WHY or pointing to insights from the data or story.
- asking a question/comment that would make me think or curious to figure out. (such as this follow-up Q)
- A comment suggesting different/new efficient methodologies.
The points in bold are features I have considered when building my solution “vzdat!”.
Need Finding
In addition to talking to prospect users, I looked into different communities where data is discussed. I first looked at news outlets such as The Upshot and The Economist and social media websites such as twitter. My goal was to identify recurring patterns and practices around discussing charts as shown in the snapshot below.
It was clear that there were general patterns. When data is discussed over the web in a lightweight format (e.g tweets, comments, blogs replies etc) users tend to use a lot of numbers. The following are the main tasks ordered:
- The discussion involved replies and comments on the visualization wanting to know how to reproduce (asking for data and code)
- Replies had users pointing at numbers in the visualization or actually screenshotting and replying with the image with their comments.
- Design Critique on the type of visualization used or other aspects of design like color and text.
- Comments involved teachers and members of the community expressed their intent to use those visualizations to educate their community about the domain in which the story of vis is about. (purpose of narration) guided tour (videos to show) gapminder Keyframes in creating animated interactive visualization (narrated visualization) (northwestern) (
Domain experts who started a vis story, reply to people’s questions about the domain with more visualizations.
Scope
For the sake of this milestone and class, I narrowed down the scope of my audience to a safe community on reddit called r/dataisbeautiful. According to their definition of the community: it’s “a place to share and discuss visual representation of data: Graphis, charts, maps, etc.” The community lists many posts that are a composition of a visualization with a title and a description by the author of how it was made and his or her design rationale. In addition to that, users can comment on the main story and reply to each other. The community is for professionals and amateurs, experts and novices. I looked where the action is and it’s in the community itself in addition to “discord” (the chat community associated with it). The posting rules of this community are simple. Anyone can post as long as their post contains a data visualization, mention the source data and indicate if it’s their original contribution or not.
Home page of r/DataisBeautiful. Each post is a data story and community members get to participate and reply to that story and to each other.
Qualitative Work
In order to better understand and identify the needs of r/dataisbeautiful I followed a mixed approach. I participated as a member and as an observer in r/dataisbeautiful. I used content analysis [6] and participation observation [3]. I wanted to ground my work so I looked into 7 reddit posts with more than 500 comments, I coded the comments with open codes and iterated 2 times until I felt I have a saturated list. The first pass helped me identify general trends in the community. The second pass was to saturate and confirm my coding.
Digital Ethnography and Contextual Inquiry
I spent almost 4 months in r/dataisbeautiful as an active member. I looked into how users comment on each other and on the main post. What I find very fruitful about that community is the nature of comments.
Rules for posting on r/dataisbeautiful
Most comments are meta talking about the visualization or chart. As we will see in the codes section, a lot of these comments were critiques, either the data, chart type, analysis or aesthetics. There was also a tendency to reproduce work and share it either as a new post or in the comments. Some users talk about aspects of the visualization configuration.Others address data issues that were clearly manifested by the data visualization. (users see triggering component in the vis, look at the dataset as a result then comment)
Coding system used to analyze the comments
While coding the data I looked into intentions of users, why: critique, suggest, inquire etc. I also looked at how and what users comment, while reddit is strict regarding the comments and only allows text. Some users post links either to their improved visualization or their suggestions to the main author. Finally I also looked at who the audience is, the author and the commenters. I identified some personas in which I can design for which includes learners and experts. The following snippets are screenshots of comments on different posts. From these comments I was inspired with the functionalities that I added to vizdat.
The following quotes are comments that were encoded and indicates some meta discussion.
vizdat!
Vizdat was built based on the user needs identified before. It offers an ecosystem for creating commenting with charts on the web. Building an extension was ideal since the idea is to modify web pages to allow charts to be rendered and add new elements to the comments sections.
Function list
- render visualization on page when links of vis are detected
- Allow users to reply with viz organically from the comments section
- Reply with viz: loads the vis associated with that post to blend in with the Reddit UX
- Edit viz and reproduce vis in situ in the comments section (seamlessly)
- Have the data and vis in one resource if user clicks on the rendered interactive vis or links
- Edits include: change type, scale , colors, story , data type
Challenges
Technical challenges
The first challenge I faced to address the needs on reddit, is a technical challenge. R/dataisbeautiful only allows for text and images post, no code or markup could be embedded. Comments also are text only. Reddit users React which is a front end framework and they tend to have a weird behavior in layering pages. Also, the class and id names for their elements are random and the names can’t be tracked or selected. All of that made it so challenging to manipulate the DOM and actually have the extension render charts and buttons to facilitate commenting with charts.
Asking the discord community about the technical challenges.
However, with continuous iteration and testing I was able to build a tool that fits in well with the reddit community (vizdat is generic for all websites with discussions, but i had to customize the extension for reddit at some part of the UX).
Social and Moderation Challenges
Now that the tool worked, I tested it out in r/dataisbeautiful. The community is well known to be passionate about data visualization. I posted 3 posts and received very few interactions and I wasn’t able to put up instructions to use the tool, so the comments I ended up receiving weren’t using the tool.
Example of the comment I have received which i have incorporated as a feature in the tool (co-design)
I reached out to the moderators for help but I was told advertising tools in the community is not recommended and could lead to posts being removed. The moderation on r/dataisbeautiful was challenging when it comes to research, specially that my tool is still in its testing phase and asking users to adopt a new tool requires more control over the type of posts (pinned post with instructions for example.)
In order to overcome that adoption and moderation challenges, I created a subreddit r/vizdat that simulates the rules and constraints of r/dataisbeautiful. The only difference is that I am the moderator and can easily mandate rules and keep posts. The goal of that subreddit is to usability test my tool.
vizdat co-design and usability testing sessions
I tested the tool with 10 users, 2 in r/dataisbeautiful and 8 in the simulated community r/vizdat . Each user study session lasted between 60 to 90 mins. The sessions were on zoom and I asked users to share their screens, follow the instructions provided in the community and think aloud. Other than co-designing and usability issues, I was interested in the thinking process that users go through when looking at other charts and what kind of comments are enabled using this tool.
Users of the study were a diverse set of participants. 4 were data experts in their field (2 medicine, 1 linguistics, 1 clinical dietitian). They use analysis tools such as SPSS and sometimes Excel to manipulate their data. They create visualization using these tools and share them in their reports and papers. The other 6 participants were computer scientists who are comfortable with programming and technology but rarely visualize.
Results and Discussion
To my surprise domain experts did a better job generating charts with good stories than those who are computer scientists and tech savvies. It was easier for them to frame a narrative and then build a visualization. The limitation could be that the CS sample didn’t include visualization in their workflows and had difficulty story telling. When building vizdat I made sure it was easy enough for anyone to use. The idea is to have a visualization as a lightweight easy step in online discussion. This first pass of user study is more to tackle the usability issues. Some of the main issues were:
1- Some users never used Reddit in their entire life, this was one of the biggest issues. Posting on reddit is not intuitive especially if the subreddit had restrictions in commenting (only links and images allowed). I had to show them to reduce the learning curve.
2- Users who chose to visualize their own data shared their data cleaning process. While this is out of scope it was useful to see how these users were also struggling with their own current flows. Vizdat gives users the ability to do some data manipulation such as changing data types and so on.
3- Some users lack knowledge in info vis (e.g. representing nominal vs quantitative data) the tool was helpful for them in which it provides a cue of the data type. However, they need more than that, for example a help button and a tutorial to educate them in the basics of info vis.
4- Some users asked about the provenance of the data, the tool allows users to fork visualizations and data in order to create their own, while the forking feature was clear, users wanted to see the lineage of users before them.
5- the first batch of users were so helpful in framing my instructions. One user suggested having in the instructions two images one showing the community without vizdat and the other with the extension. Another one found it really useful to have the video with the instructions as opposed to reading text.
7- Most users like the feature in which vizdat automatically creates a starting chart based on the data they have uploaded. However, one user mentioned: “the auto viz thing primed me, i feel it affected my judgment to go with your suggestions.” That was when she created a post. It was a different case when she commented since it was clear what she actually wants to do.
8- Usability issues such as were to click to close a window and how to share were addressed in the final version shared in chrome store.
Future work
- I’m planning to follow through with the suggestion from the r/dataisbeautiful moderator. While he recommended not spamming the community he suggested reaching out directly to users in the community and asking them to post. That way I will make sure I’m recruiting a more relevant sample for my study.
- To scale and have a better sense and observations, I’m planning on starting a visualization GAME in r/dataisbeautiful (if the mods allow me). The game idea is to have a main post and as users to comment with another chart using the data but telling a different story. The last person in the game who successfully reproduces an interesting chart is the winner.
- On r/vizdat the simulated community. One user posted something NSFW see screenshot below. The way twitter works is that it doesn’t render any link or thumbnail if the post is marked as NSFW. However, vizdat renders any visualization link created with the tool. As a moderator and a tool builder, in my future work I will think about how to make sure a community is a safe space even with the tool? One idea is to detect the word NSFW in the web document and not render.
Acknowledgment
I would like to thank Ethan for his continuous support and great advice during and before the class. I would like to thank Nathan Mathias for showing me the way on Reddit and the moderators. I would also like to thank Anna for her support and patience in replying to my questions. Finally, if it wasn’t for my advisor David Karger’s direction and his trust in my ideas, I wouldn’t have had the freedom to explore the “what-ifs” in research and online discussion.
