Please check out the live demo.
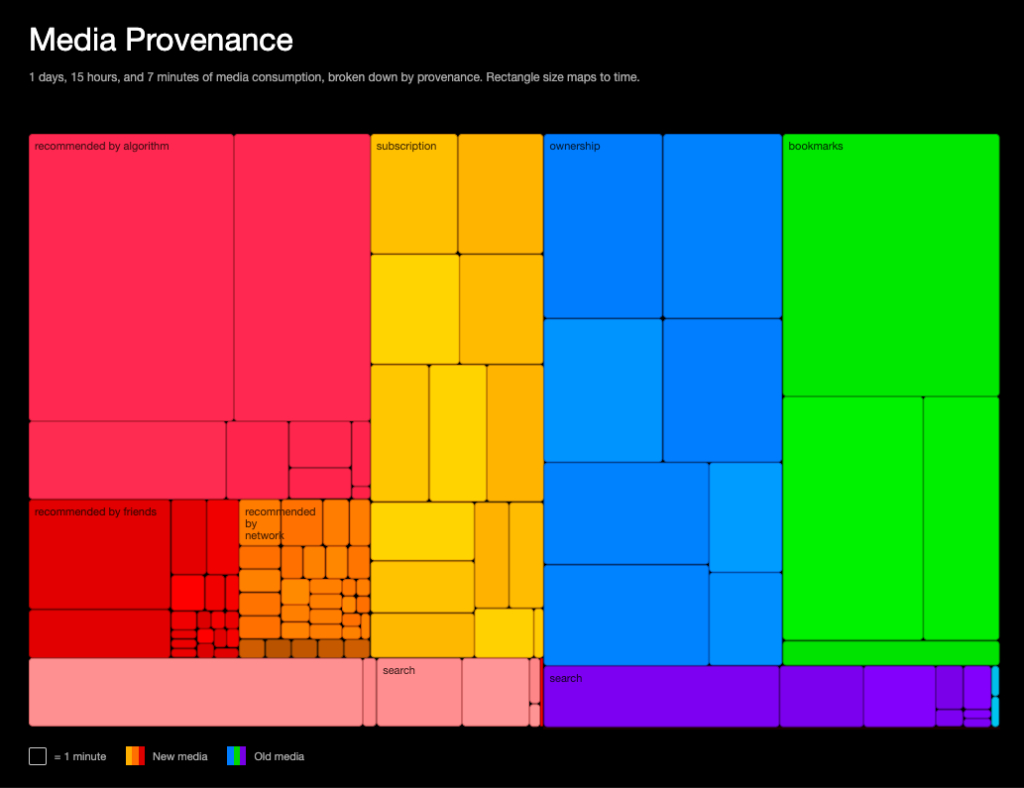
Over the course of seven days, I recorded a data point each time I engaged with published content for ~10 seconds or more. This visualization groups those many pieces of content based on their provenance (e.g content that I deliberately access versus content recommended by algorithms). Each piece of media is represented by a rectangle, and its size is based on the time I spent with it. The resulting visualization shows the footprint of various access channels on my media consumption.
As it turns out, my media diet is mostly composed of content whose provenance I control: physical media I own, Youtube channels I subscribe to, and chronologically-sorted Twitter timeline. My interaction with recommendation algorithms and ads is limited to my music consumption: Spotify is almost the only space where I let the machine dictate what comes next. Hypertext links used to be a driving-factor in content discovery; here they’re only responsible for a tiny fraction of my consumption.
What doesn’t appear here is the many hours spent scrolling aimlessly on Twitter (chronological) and Instagram (algorithm-curated), as I look, but barely engage with the conversation.