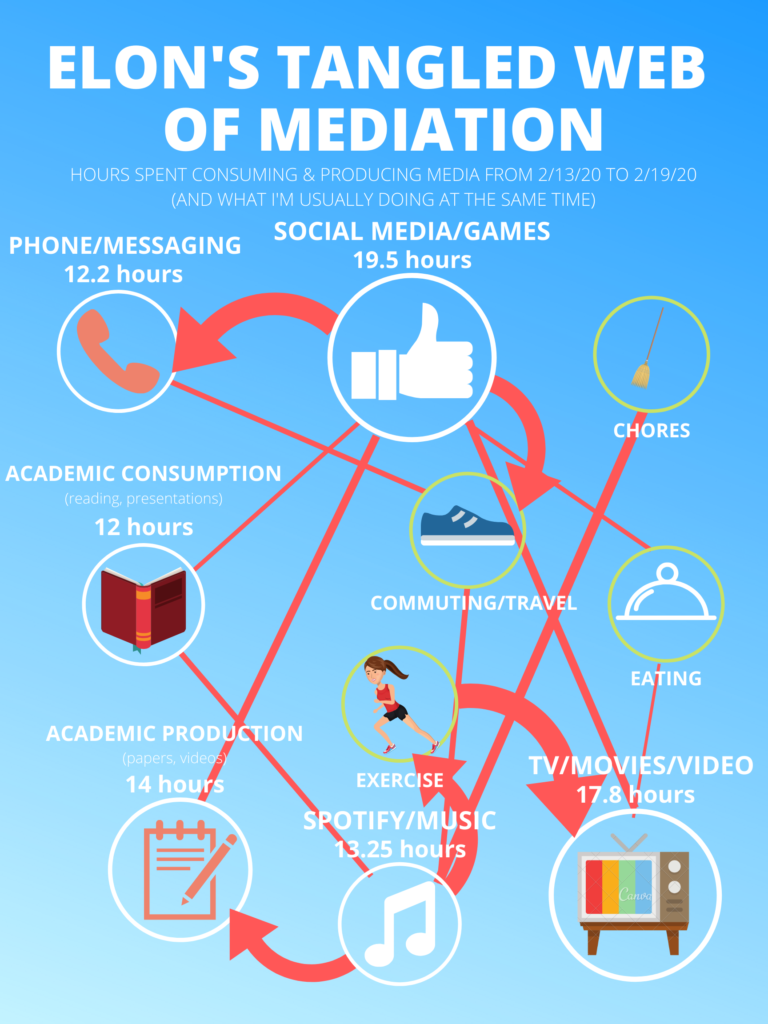
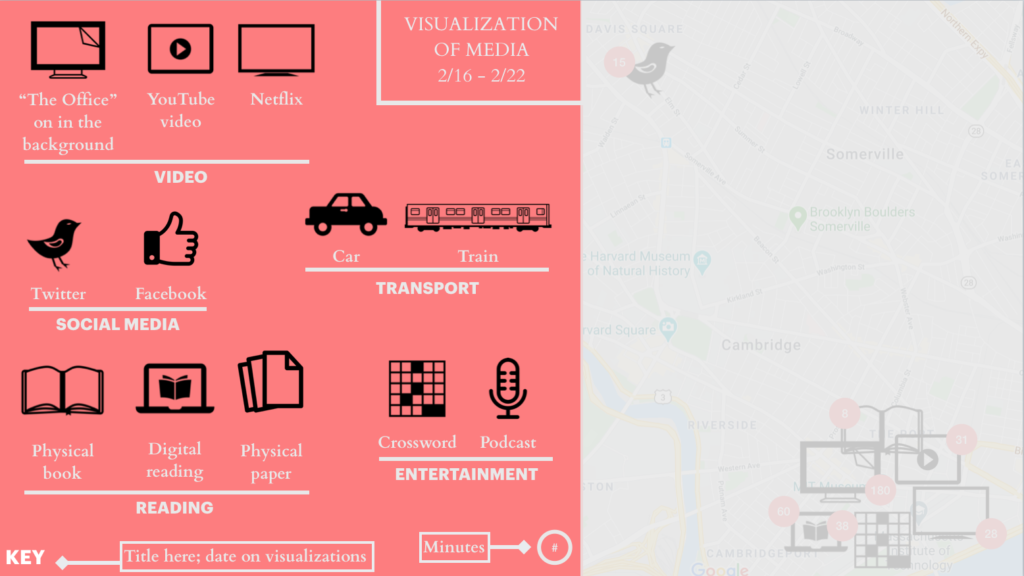
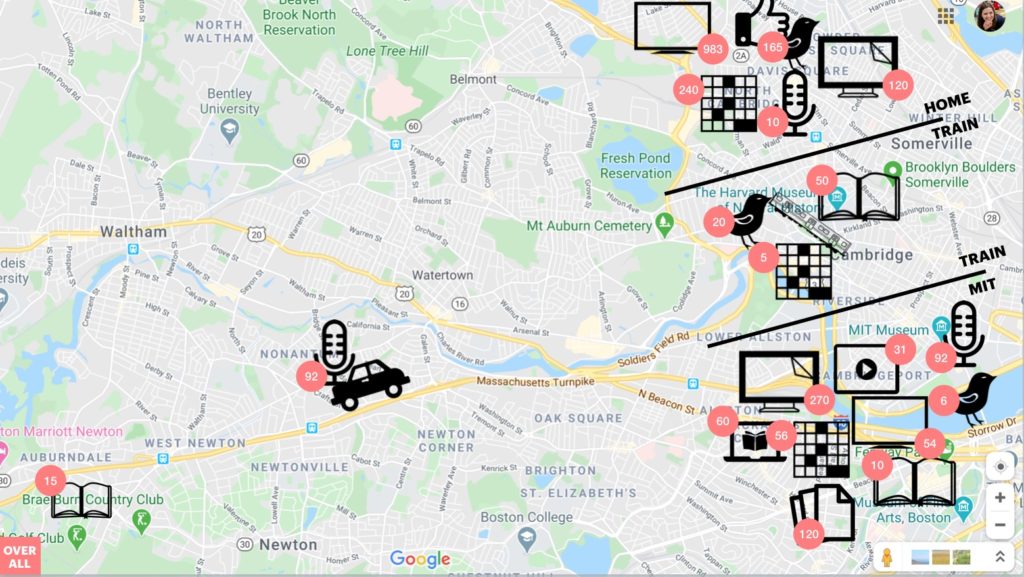
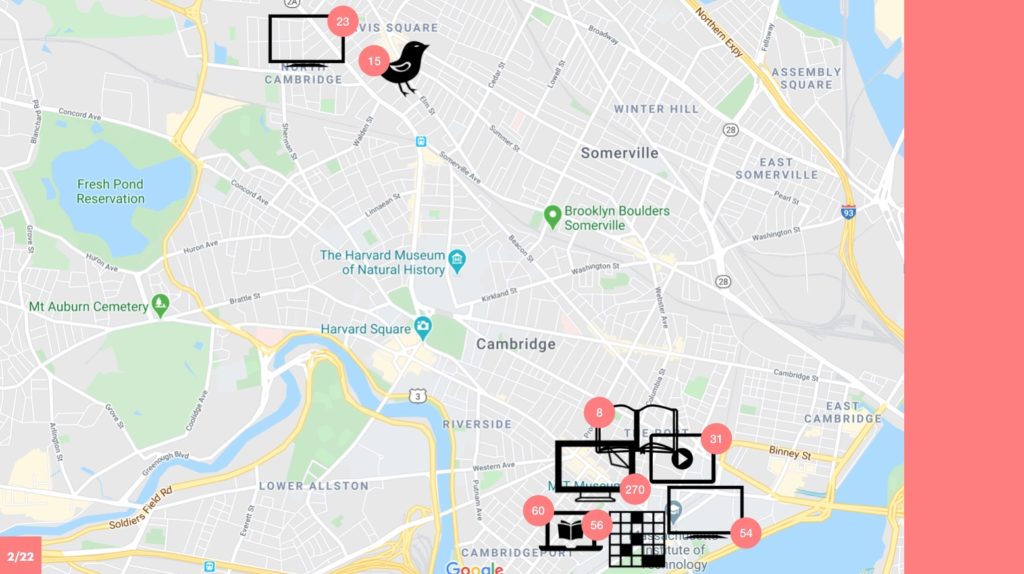
While collecting data for my media diary, I was struck by the realization that more often than not, I’m consuming media while I’m doing something else – eating dinner, washing the dishes, walking to class. Even more, I noticed that I’ll often consume media while I’m consuming another type of media. This chart reflects the myriad ways I like to consume media, often concurrently. The numbers below the media reflect the total hours spent consuming/producing that type of media for the week, and the lines and arrows reflect the activities I most caught myself performing while being mediated.
During the week-long span from Sunday, February 16, to
Saturday, February 22, I recorded all of the media that I consumed in a
“media diary.” The way I defined media was anything that portrayed
information or entertainment to me through a screen, text, or audio source.
Note that I did not include in-person interactions as media so long as they
were free from the use of technology to enhance the conversation/interaction.
This exercise taught me quite a bit about my personal habits and what I might
do to be in better control of those habits. While it is nice to not need to
write everything I see/hear, I am grateful for the added layer of thought I
have added to my subconscious when I am consuming media of any variety.
In my media diary, I simply wrote five things that defined
each entry: 1) the date I consumed the media, 2) the title of the media I was
consuming, 3) the general medium through which I was consuming the media, 4)
how much time I had spent consuming the media, and 5) how deliberate I was in
seeking out that particular piece of media. Again, just by writing these things
down, I became more aware of how often I might “waste time” doing
things that aren’t immediately important when I could be spending my time on
other priorities.
In order to get a better sense of what this data looked
like, I decided to focus in on three main points to visualize: what general
purpose the media held at the time of consumption, how much time I was spending
consuming that media, and how deliberate I was in seeking that media out. I
chose to visualize this data using a simple particle simulator (adapted from an
idea that I had to implement in another class). As you will see below, each
individual particle is a single entry of media that was consumed. Three
variables in the particles symbolize the three parameters I was focusing on,
and they are as follows:
Category (color): I whittled down my media
consumption into four categories–recreation (red), spiritual (yellow),
productivity (green), and family/social (blue). Starting from the end and going
backwards, family/social signifies any consumption of media that I used to
communicate with my friends and family, such as phone calls, video chats, and
text messaging; productivity means anything that was used to accomplish tasks
necessary for classwork, research, and general future career needs through
email, presentations, online textbooks, etc.; spiritual is for any religious
media that I consumed that goes toward helping me be a better person and
building my faith, such as reading scriptures, listening to talks and lessons
at church, and so forth; recreation is for anything else that doesn’t fit into
one of the other three categories, including YouTube videos about my hobbies,
playing video games, watching movies or sporting events, etc. I could have done
just two categories or added even more, but these four categories paint a
fairly full story.
Duration (size): the bigger the particle, the longer
I spent involved in a particular activity. Among the longer-lasting forms of
media were movies, sporting events, and classes. The smaller ones include
checking emails, using social media out of boredom, and so forth.
Deliberateness (speed): the speed of the particle is inversely proportional to how deliberate I was in consuming a particular piece of media. Namely, the slower the particle, the more steady and deliberate I was in choosing to consume that exact piece of media, and the faster the particle, the more spontaneous and distracting a piece of media was, almost thrust upon me, whether by an algorithm or by my two-year-old daughter.
So, without further ado, here is my week visualized:
Sunday: we went to church (big yellow particle) and then mostly relaxed by watching a movie, then I watched the NBA All-Star Game (the biggest red particle) Monday: this was also my “no phone day” for Assignment #1. I was mostly doing homework and was able to stay extremely focused beyond a few distractions that I had to pretty deliberately seek out on my laptop. Tuesday: with my phone back, I felt more compelled to get “caught up” on social media since I hadn’t even really used it without my phone. I had some meetings and was able to still be fairly productive, though. Wednesday: similar to Tuesday, but with class thrown in there. Quite a few quick but spontaneous distractions. Thursday: another class, a phone call with family, and some more homework. Friday: final class of the week, and nothing else much productive beyond that. I was certainly ready for the weekend. I made a couple of calls to my parents, as well.Saturday: I was able to get some homework done, but I was certainly distracted and enjoying myself since it was the weekend. My daughter wanted to watch a movie, and I kept getting sucked into social media since my “Digital Wellbeing” helper functions aren’t active on Saturdays. I can definitely see how much they help. The full week combined: Classes, church, movies, and sporting events are the bigger particles, while checking social media and emails, as well as reading random articles here and there are the smaller ones.
As you can see from the data above, there tends to be a
majority of recreation-centered media consumption in my life. Perhaps it’s due
to how exactly I defined media, but it’s still quite apparent that I use a lot
of media to entertain myself. That being said, I do use media for a lot of
productive things. It’s ingrained into the classes I take, doing my homework,
setting up meetings with people, and many more things.
The biggest takeaways from this data for me, though, is that
the bigger items are typically slower than the smaller items. I’m spending a
majority of my time really focused on specific tasks that I have personally
decided to enact. While there are several little distractions throughout the
day, they don’t completely dominate my time. Adding them all up definitely
would show quite a bit of time taken away, though, so I want to be better at
eliminating that usage, especially when it’s something not very important.
Overall, seeing this data has helped me to understand my
media usage and habits better, and with that better understanding, gives me
some ideas on how to better set expectations and boundaries for myself to be
more in control of what I do each day. And for that added insight, I’m very
grateful for the experience. But I’m sure glad I don’t have to write everything
I do down in my little notebook. I found myself not wanting to give in to every
impulse because I didn’t want to write it down. That’s honestly not the worst
thing, though…
Each object represents an hour of media diet: the rubber duckies represent Twitter, the toy cars represent a play I attended, the mixed toys represent other Internet including email usage, the Thomas trains represent magazines and newspapers including paper and via apps, and the Starburst represent TV.
Notes: – Each measure represents one hour; a quarter note is 15 minutes. – During chunks of time during which I was moving back and forth between two media (using a computer and writing on paper while doing homework, for instance; or listening to music and talking to friends while hosting a party), I alternated the chords in question, either quickly if the transitions felt fast or slowly if the transitions felt more fluid. – Each chord is coded with a broad category as the lowest note and tweaks built on top:
Any time I was having a conversation, the lowest note is middle C; other notes you might see for a conversation are D (for digital conversation), E (spoken aloud), F (with non-friends), G (with friends).
Similarly, the base note for listening is D, tweaked with F for music, G for a lecture, A if it was for fun and B if it was mandatory. (A podcast counts as a fun lecture.)
The base note for reading is E, tweaked with A for books, G for articles, B if it was for fun and high C if it was not for fun.
The base note for watching is F, tweaked with A for TV, G for a movie, and C for exercise content.
The base note for writing is G, tweaked with B for on paper, D for on a computer, and F if it was for a loved one. (An email is coded as writing, but texting is coded as a conversation.)
The base note for other digital activity is A, tweaked with C for games, D for social media, and E for homework or other computer use.
A bonus note, B, lives on its own and stands for walking around in the world.
– Here’s an audio file in case you’d like to hear what it sounds like. (Not very good!!) It was recorded at double speed because some of the extended blocks get a little boring in 4/4 time, and to keep the recording under two minutes.