Categories
Uncategorized

Media Highway

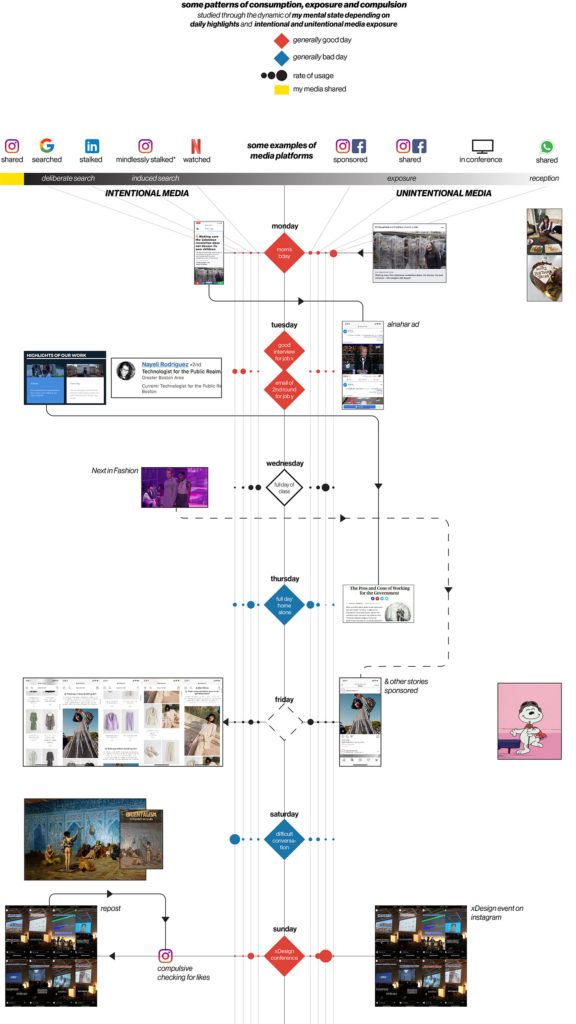
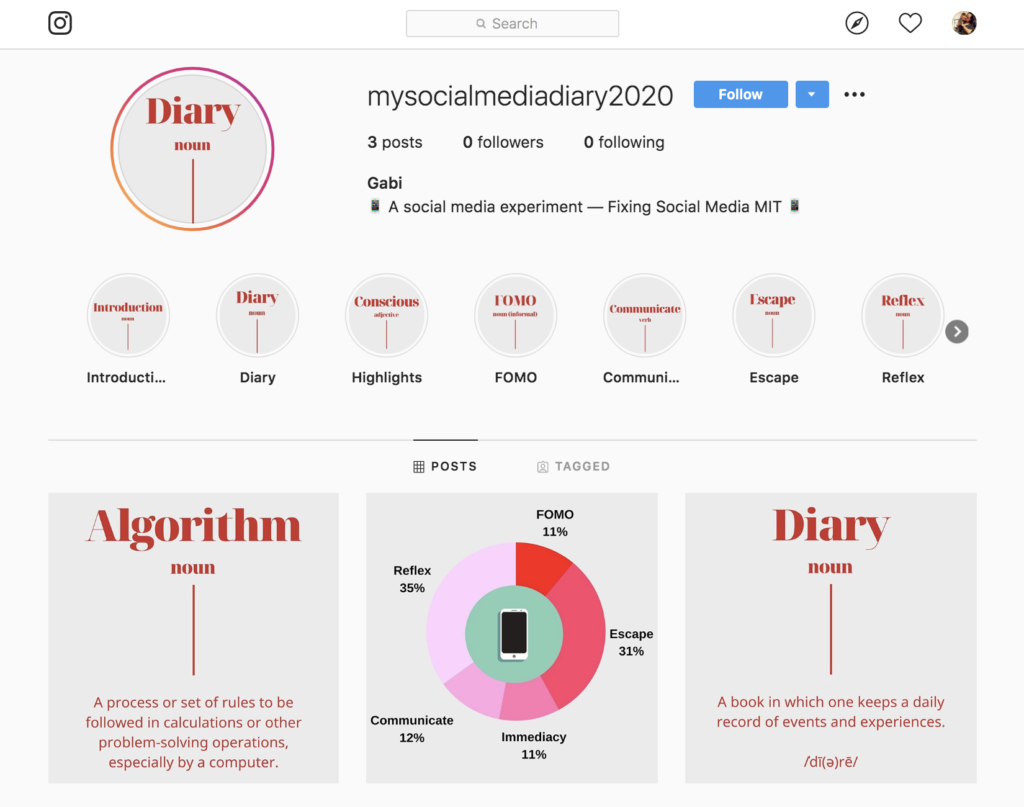
I kept a diary of all my media consumption throughout the week, by recording each “piece” of media (for example, one article, one book), and coding them along several dimensions in a spreadsheet (such as: device used, primary / secondary source, reason accessed, found via algorithm or not, etc.). 

My Lifelong Kindergarten colleagues Shruti Dhariwal and Manuj Dhariwal have been working on an extension to Scratch for exploring probability (called “Let’s Chance”). I remixed one of their example projects (Wish a Fish) to make a highway with devices passing by – each representing an object for accessing media (computer, book, newspaper, phone, movie). 

The objects appear in keeping with the frequencies of my use of them in the past week.

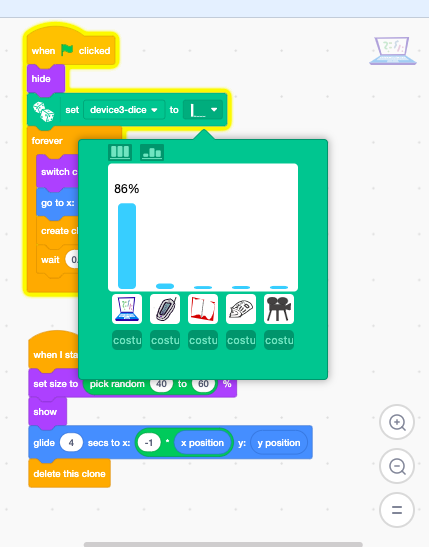
Here’s the Scratch project (as a screen recording – the actual project was made in a separate GUI that they are working on).

media-highway

Here’s another one, representing how much of my media consumption was algorithmically generated. Yellow is algorithmic, blue is not.

Other findings:

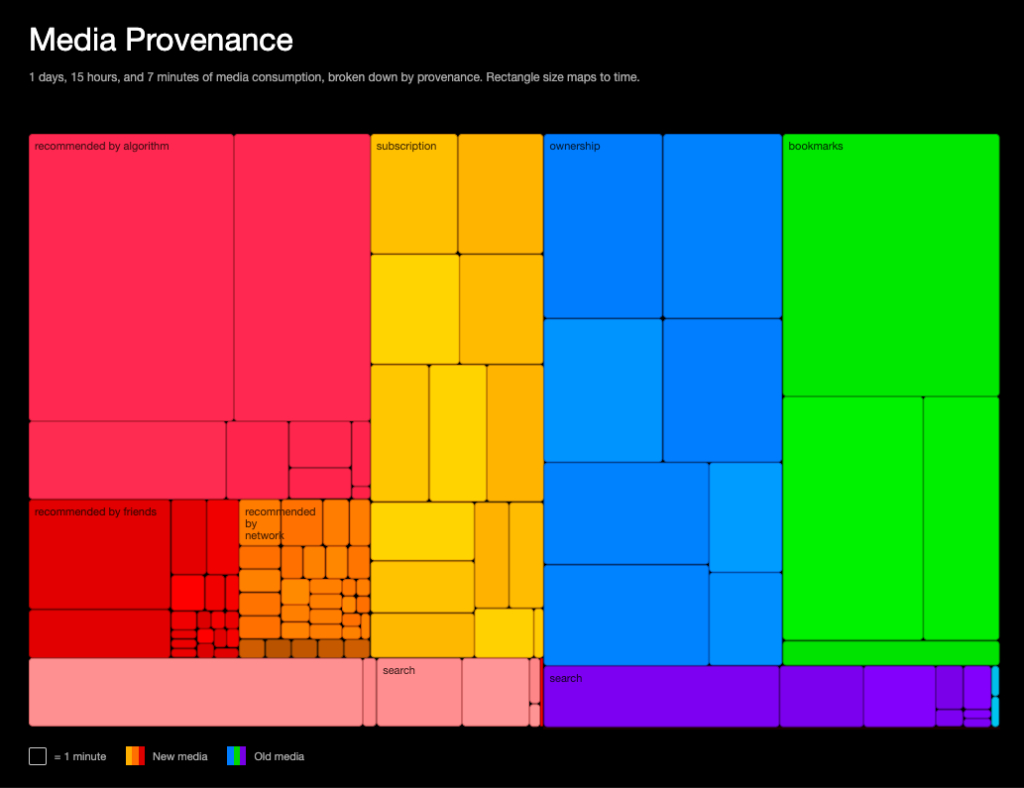
  • 30% of my media diet appears to be algorithmic in nature. But it’s hard to know, in an algorithmic world, how many are “second-hand” algorithmic – if someone recommends that I watch something that Netflix pushed for them, I’m still under some algorithmic influence, arguably. Of the media I encountered, 10.5% was recommended to me by other people.
  • My “diet” is fairly balanced between primary and secondary sources. 
  • 22% of media was required by my courses. 
Categories
Uncategorized

Media Patterns: mental health vs media exposure

For the past week, I wrote down every day my media consumption, but also my daily mental state (as I always do).

I spoke on the phone and checked compulsively instagram>whatsapp>mail. I also lost my phone and lasted a day without checking my mail. I went into spirals of stalking people in Tech companies on LinkedIn, and binge-listened to a podcast. I also ordered 3 books.

I want to understand what is causing these different patterns of consumption, exposure and compulsion. What I will focus on is the relationship between my mental state as reflected by some daily highlights, and my exposure to media (both deliberate and unintentional).

When I am most susceptible to compulsive behavior? When I most susceptive to procrastination? Are sponsored ads a reflection of my late night googling?

Below is a summary of my media diary this week. The right side shows unintentional media, and the left shows more intentional media (here is a rough gradient from least intentional to most intentional media exposure):

  • Shared WhatsApp media
  • Media from conferences
  • Shared media on Facebook and Instagram
  • Sponsored media on Facebook and Instagram
  • Watched episodes on Netflix
  • Mindlessly spiraling from account to account on instagram
  • Searching for LinkedIn profiles
  • Searching on Google
  • Sharing my media

Each row represents a day, and the red and blue Rhombi (red for high mood, blue for low mood) encapsulate a daily highlight. The dots on both sides of each Rhombus, show the rate of the different unintentional and intentional media exposures.

I discovered that during days that I felt in a bad mental state, I would use google more than on other days (25 min more on average). I searched increasingly for answers when I was feeling dissatisfied. This led to ads on Facebook and Instagram the next day – acting as a reminder and continuously affecting my mood, but on a more unconscious level. I also noticed that when I was in a good mood, I was generally more energetic, and would be more compulsive. I checked my phone much more than on lower energy days. Compulsion came with high energy contrary to what I had assumed (that lower mood causes distraction and thus more compulsive behavior).

The dynamic of intentional and unintentional exposure to media was also affected by my willingness to be sucked in and distracted from my priorities. When I was feeling low in energy, I procrastinated more, and it was easier for me to infinitely scroll. I was also more inclined to click on some of the sponsored ads.

Categories
Uncategorized

Media Diary: Provenance

Please check out the live demo.

Over the course of seven days, I recorded a data point each time I engaged with published content for ~10 seconds or more. This visualization groups those many pieces of content based on their provenance (e.g content that I deliberately access versus content recommended by algorithms). Each piece of media is represented by a rectangle, and its size is based on the time I spent with it. The resulting visualization shows the footprint of various access channels on my media consumption.

As it turns out, my media diet is mostly composed of content whose provenance I control: physical media I own, Youtube channels I subscribe to, and chronologically-sorted Twitter timeline. My interaction with recommendation algorithms and ads is limited to my music consumption: Spotify is almost the only space where I let the machine dictate what comes next. Hypertext links used to be a driving-factor in content discovery; here they’re only responsible for a tiny fraction of my consumption.

What doesn’t appear here is the many hours spent scrolling aimlessly on Twitter (chronological) and Instagram (algorithm-curated), as I look, but barely engage with the conversation.

Categories
Uncategorized

My Media Diary via Instagram Stories

Please go to @MySocialMediaDiary2020 on Instagram and check the Stories Highlights.

Categories
Uncategorized

Media Diary: as told by a GIF

An ode to our Professor Zuckerman’s invention: the pop-up ad. I recorded snippets of my “IRL” activity and included bursts of messages and calls that pulled me away from the present.

In my visualization, I feature “IRL” moments of my week that felt fun, spontaneous and “connected”; moments that felt shared with others.

Bursts of digital communication in the form of text messages and calls “interrupt” those moments as they pop up throughout the day.